What's new: Why use Reports
Let's see what you can do with reports (or what you cannot do without reports). For example we will take default entity Task.
Gather entity detail information into one document
Task detail view consists of multiple tabs with sets of task properties shown on each tab, so you cannot see them all at once.
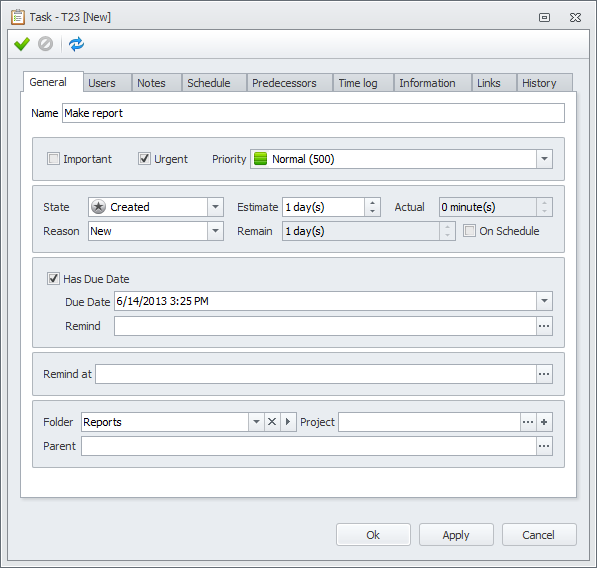
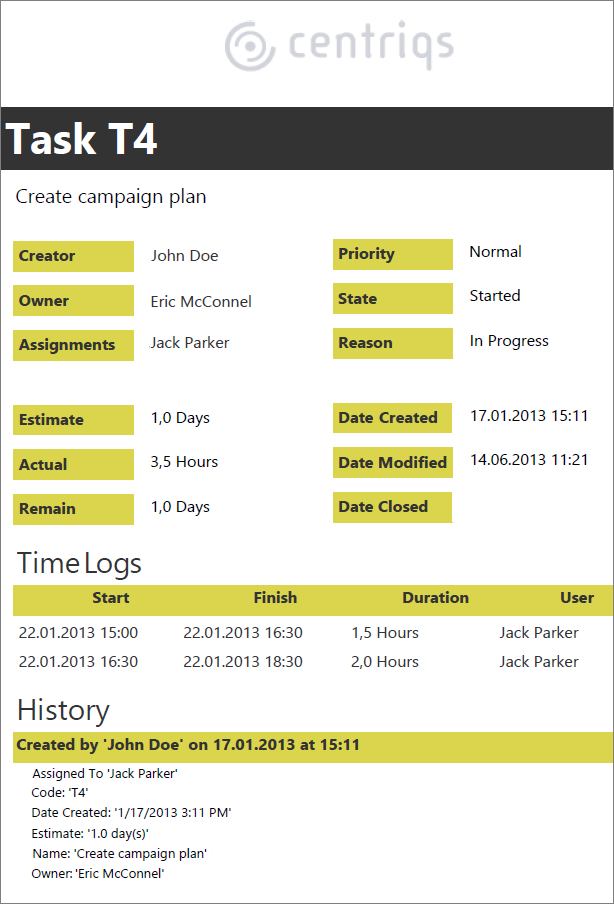
Reports let you gather all or selected task properties into one document. Your report can show even those task properties which are not shown in the task detail view, for example, Deviation, Number of Subtasks, etc.
Gather multiple analytic views into one document
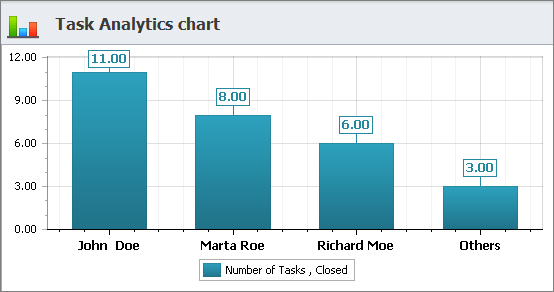
Task analytics (or task analytics chart) view can display only one pivot grid (or one chart) at a time.
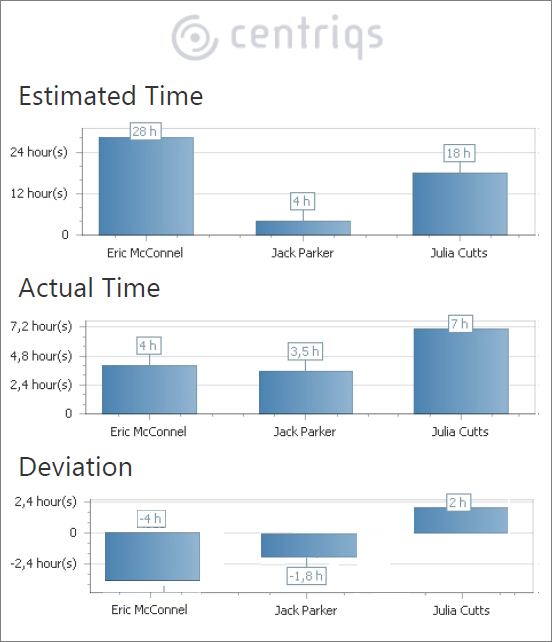
One report can contain as many pivot grids and charts as you need. For example you can compare Estimated and Actual task duration and see the Deviation from the plan by each user.
Combine entity detail information and analytics data in one document
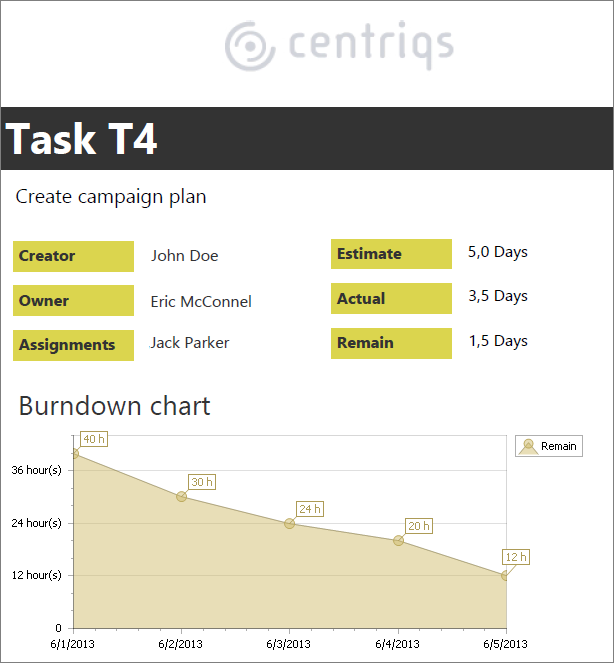
There was no possibility to display task detail view and task analytics view together. Now users can combine task detail information and task analytics view in one report. For example, your report can contain Estimate, Actual and Remain values which are illustrated by burndown chart.
Combine data of multiple related entities, their tables and analytics
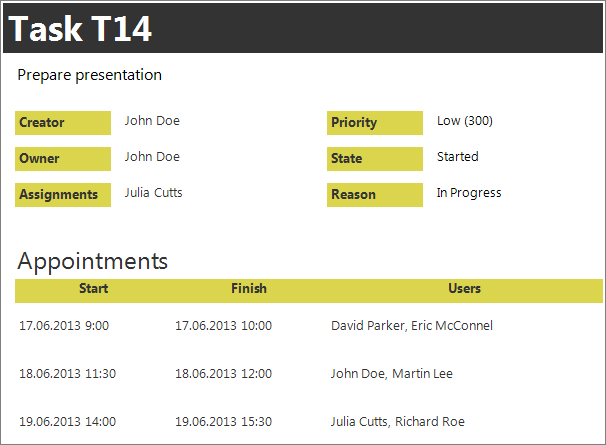
If you have related entities (for example, entity Task can be linked to entity Appointment), you can create reports that show information of one entity together with data of related entities (for example task details with appointments related to the task).
Other features and tutorials added during the Spring 2013:
New tutorials: